Quality Dividend Yield
Providing high levels of current income, from attractively valued, higher-yielding, large-cap equities.
Overview
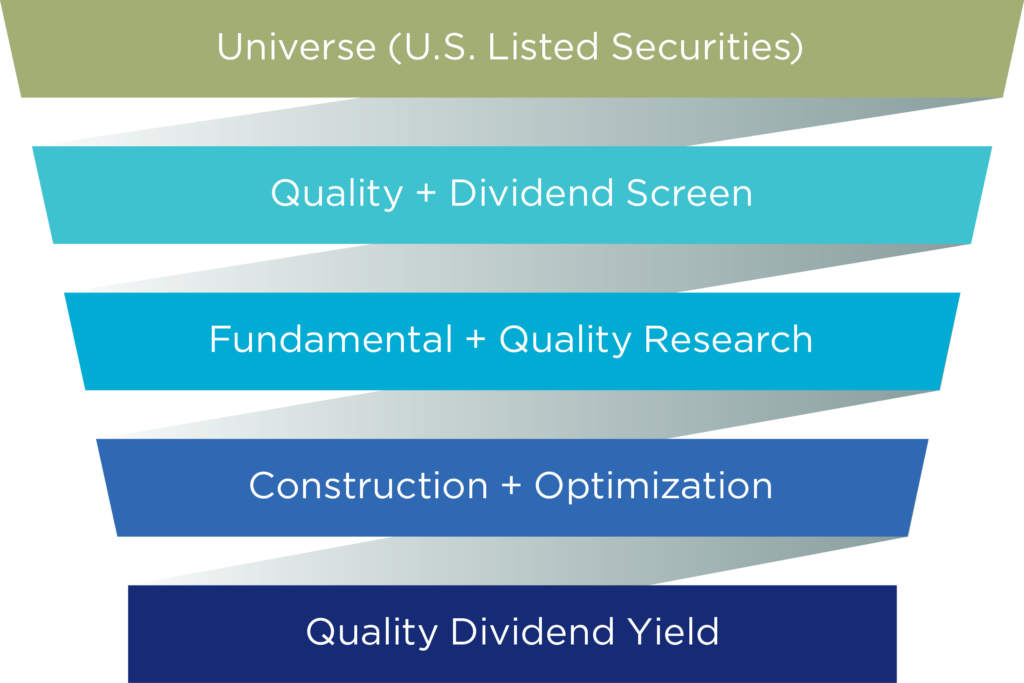
Haverford’s Quality Dividend Yield Portfolio is designed to meet the needs of investors who desire a balance between current portfolio income and the opportunity for future appreciation. We choose companies for the portfolio based on superior financial strength, above-average and consistent earnings growth, regular and growing dividend payments and a strong competitive position.
Investment Philosophy
Investment Process

Portfolio Characteristics*
Characteristic |
Haverford |
S&P 500 |
|---|---|---|
| Financial Strength | A+ | B |
| Earnings Predictability | 81 | 65 |
| Average Market Cap ($Billion) | 464 | 882 |
| Projected EPS Growth (5 Years) | 10.5% | 14.1% |
| Historical EPS Growth (5 Years) | 6.7% | 7.1% |
| Hist. Dividend Growth (5 years) | 7.7% | 5.5% |
| Dividend Yield | 2.9% | 1.3% |
| Price to 2024 Earnings | 17.4 | 20.6 |
Sector Allocation*
Characteristic |
Haverford |
S&P 500 |
|---|---|---|
| Communication Services | 3.12 | 8.91 |
| Consumer Discretionary | 10.30 | 10.46 |
| Consumer Staples | 12.41 | 6.06 |
| Energy | 4.21 | 3.80 |
| Financials | 12.08 | 12.98 |
| Health Care | 12.92 | 12.68 |
| Industrials | 12.93 | 8.68 |
| Information Technology | 22.75 | 29.58 |
| Materials | 5.86 | 2.31 |
| Real Estate | 1.51 | 2.35 |
| Utilities | 1.90 | 2.20 |
Top-Ten Holdings*
Yield |
2023 P/E |
|
|---|---|---|
| Microsoft | ||
| JPMorgan | ||
| Merck | ||
| QUALCOMM | ||
| BlackRock | ||
| PepsiCo | ||
| Chevron | ||
| Dow | ||
| Home Depot | ||
| Philip Morris |
Notes
* Based on recommended portfolio weights. The S&P 500 is for comparative purposes only. The S&P 500 is a capitalization-weighted indexes, calculated on a total return basis with dividends reinvested. The S&P 500 is an unmanaged index with no expenses, which covers 500 industrial, utility, transportation, and financial companies of U.S. markets. It is not possible to invest directly in an index. Portfolio characteristics, allocations, and holdings are subject to change at any time based on market and other conditions.
Measures of Financial Strength and Earnings Predictability are sourced from Value Line Inc. Beta measures exposure to market risk.
Disclosure
All Data as of March 31, 2024. The information presented should not be construed as investment advice or recommendations with respect to specific securities presented and may not represent the holdings or weighting of any particular portfolio.