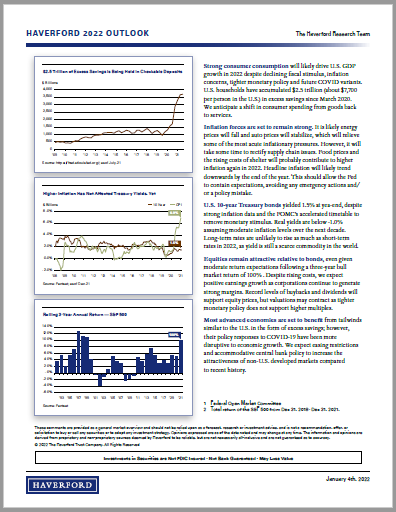
Strong consumer consumption will likely drive U.S. GDP growth in 2022 despite declining fiscal stimulus, inflation concerns, tighter monetary policy and future COVID variants. U.S. households have accumulated $2.5 trillion (about $7,700 per person in the U.S.) in excess savings since March 2020. We anticipate a shift in consumer spending from goods back to services.

Inflation forces are set to remain strong. It is likely energy prices will fall and auto prices will stabilize, which will relieve some of the most acute inflationary pressures. However, it will take some time to rectify supply chain issues. Food prices and the rising costs of shelter will probably contribute to higher inflation again in 2022. Headline inflation will likely trend downwards by the end of the year. This should allow the Fed to contain expectations, avoiding any emergency actions and/or a policy mistake.
U.S. 10-year Treasury bonds yielded 1.5% at year-end, despite strong inflation data and the FOMC’s1 accelerated timetable to remove monetary stimulus. Real yields are below -1.0% assuming moderate inflation levels over the next decade. Long-term rates are unlikely to rise as much as short-term rates in 2022, as yield is still a scarce commodity in the world.

Equities remain attractive relative to bonds, even given moderate return expectations following a three-year bull market return of 100%2. Despite rising costs, we expect positive earnings growth as corporations continue to generate strong margins. Record levels of buybacks and dividends will support equity prices, but valuations may contract as tighter monetary policy does not support higher multiples.

Most advanced economies are set to benefit from tailwinds similar to the U.S. in the form of excess savings; however, their policy responses to COVID-19 have been more disruptive to economic growth. We expect easing restrictions and accommodative central bank policy to increase the attractiveness of non-U.S. developed markets compared to recent history.
[1] Federal Open Market Committee
[2] Total return of the S&P 500 from Dec 31, 2018- Dec 31, 2021