Tim Hoyle, CFA, Chief Investment Officer
thoyle@haverfordquality.com
Friday, February 26th could be the first day of the rest of our lives.
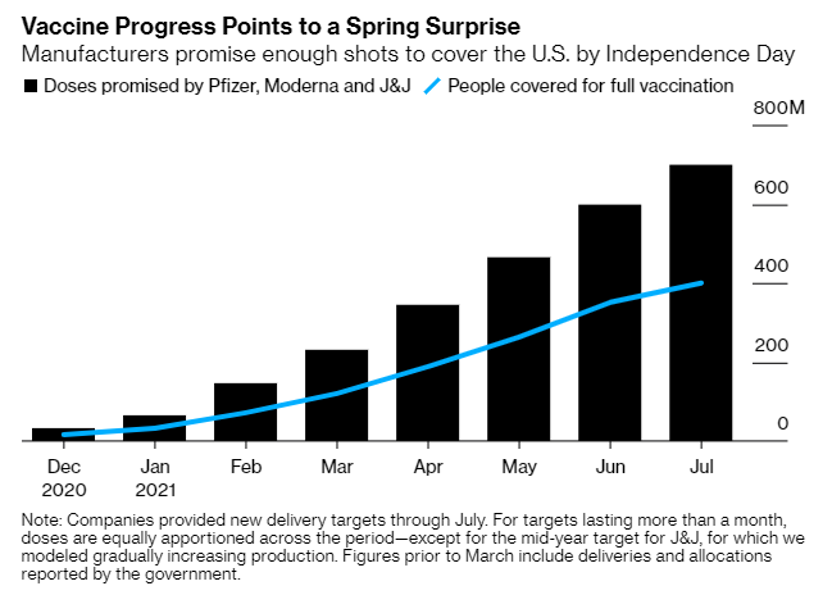
This coming Friday, an FDA advisory committee will consider Johnson & Johnson’s application for emergency use authorization for their COVID-19 vaccine. According to analysis done by Bloomberg News, U.S. vaccine supply will surpass total population by July[1]. Market research firms, including JP Morgan and Morningstar, believe the U.S. will achieve herd immunity (70% of the population inoculated or recovered from COVID-19) by early in the second quarter. This is great news for the economy and one of the primary reasons for the stock market’s continued march higher, rising interest rates (off extremely low levels), and increasing inflation expectations (to slightly more than 2%.)


Source: Morningstar, January 2021, COVID Tracking Project data through Dec 2020
Economic forecasts are ratcheting higher; the combination of monetary and fiscal stimulus, plus vaccine optimism are leading forecasters to believe the post-COVID-19 economic rebound will be significant, potentially catapulting 2022-2023 GDP to levels above pre-pandemic estimates. To paraphrase Jerome Powell, everything hinges on the virus and the vaccine; if the JNJ vaccine delivers and Pfizer and Moderna come through on their production estimates, our reality should change for the positive by year-end.
What does this mean for a stock market that is up 17% since February 19, 2020? That is the $49.2 trillion dollar question[2] – the current market value of the U.S. Stock Market. Assuming U.S. GDP is about $22 trillion, the market is valued at 220% of GDP. This ratio is known as the Buffett Indicator, after legendary investor Warren Buffet called it “the best single measure of where valuations stand at any given moment,” in a 2001 Fortune essay. Is the fact that this ratio is currently higher than at any point in history cause for concern? Yes. Is it reason to sell stocks in an effort to time the market? No.

Valuation (the Buffett Indicator is a valuation metric) has never been a good reason in and of itself to sell stocks. There are rational reasons why the Buffett Indicator could be wrong; the evolution of our economy towards software and services and the tamping down of business cycle is most compelling in my opinion. But the indicator could also be right. The problem with a debate over the accuracy of measuring market valuations is that it can distract you from the most important driver of investing returns: growth.
We seek to invest in companies with consistent, predictable, and sustainable growth. Growth in revenues, cash flow, earnings, and dividends. In the short-term, changes in valuation can drive stock prices. However, in the long-term, growth is what matters. A vibrant, healthy, diverse, adaptive, and free economy will most likely grow, and staying invested increases your odds of participating in that growth. If staying invested increases the odds of participating in future growth, what increases your odds of staying invested? That is a question for you and your trusted adviser to flush out in detail.
