Noah Fisher, CFA, Research Analyst
nfisher@haverfordquality.com
Port Congestion Yet to Show Up in Corporate Earnings
Port Congestion is yet another economic ailment resulting from the global Covid-19 pandemic. With the 3Q 2021 earnings season underway, commentary from companies has mostly focused on continued supply chain and logistics challenges, as well as rising energy costs. Despite these headwinds, of the companies that have reported thus far (around 20% of S&P 500 companies), 84% have beaten expectations for earnings per share and 75% have beaten expectations on revenues. Management teams have pointed to positive economic trends driving improving fundamentals of their underlying businesses. In fact, this past Friday, General Motors stated no plants will remain closed because of semiconductor shortages as of November 1. This may be an indicator supply chains are improving, and investors may once again begin to focus on the trajectory of growth coming out of the recovery.
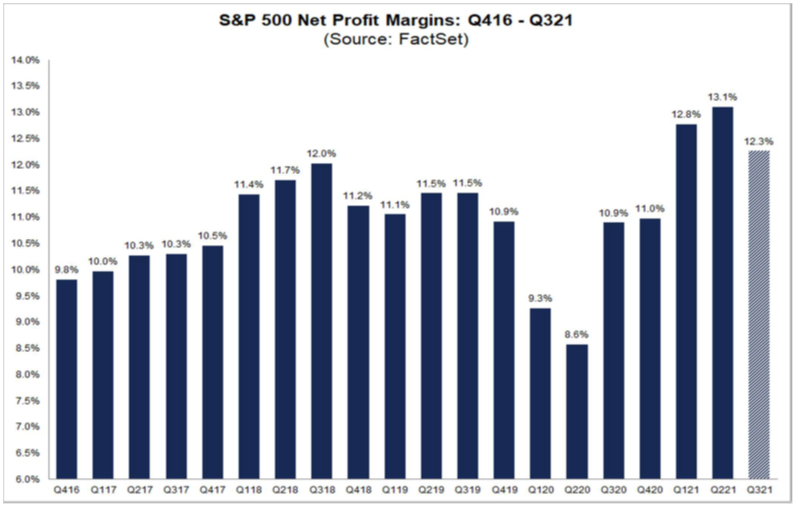
A deeper look into numbers reported by companies in the S&P 500 shows that worries about rising costs have not fully translated into an economic impact when compared to historical results. The net profit margin for companies in the S&P 500 for Q3 2021 is the third highest in recent history at 12.3%. This is only below the two previously reported quarters of 2021. This margin is also comfortably above the 5-year average of 10.9%. While companies talk about the negative impacts from supply chains and rising energy costs, some can pass these costs along to consumers through price increases, leaving their near-record high profit margins relatively intact. If the news reported by General Motors turns out to be a true indicator, earnings for the S&P 500 could accelerate at a time when profit margins are already near record highs. We believe this earnings growth supports valuations that remain above long-term averages.

