The S&P 500 made a brief visit into correction territory last month with a decline greater than 10%. The market’s intra-day low on January 24th was 13% below its closing high on January 4th. All in all, the S&P finished the month of January down 5.3%.
It is impossible to forecast if that will become ‘the worst of 2022’, and it’s prudent to anticipate more bumps in our future. What are some of the lessons we can learn from past market downturns to help us now?

Past performance is not a guarantee of future results
Since 1950, only nine out of the 36 market corrections [1] have become bear markets. That number falls to five out of 25 since 1974.
Also of note, it is rare to have a bear market without an economic recession. While the probability of a recession in 2022 is very low, anything is possible.
For the typical market correction, the median number of days for the market to go from peak to trough is 87, accompanied by an average decline of 12%. Bear markets typically last much longer than corrections, and average steeper declines with a median duration of 517 days and down 36%.
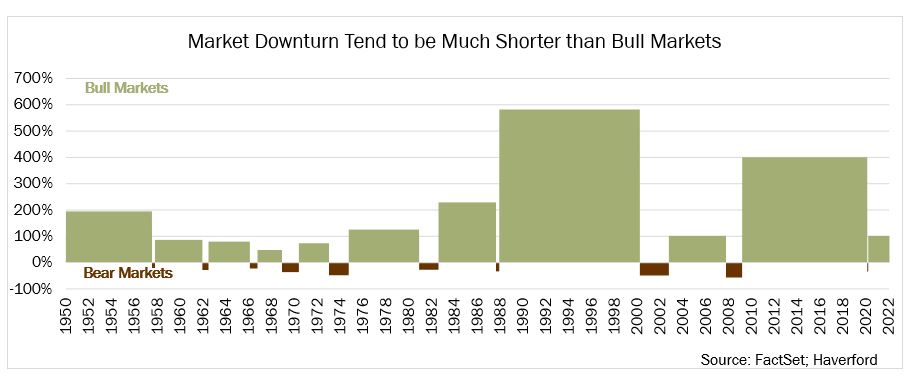
Positive news has outweighed negative over time with market downturns tending to be much shorter than bull markets. And declines often end as quickly as they began, often while the news is still terrible. These factors are what make it so hard to time the market, and why investors are often better-off standing firm during market declines.
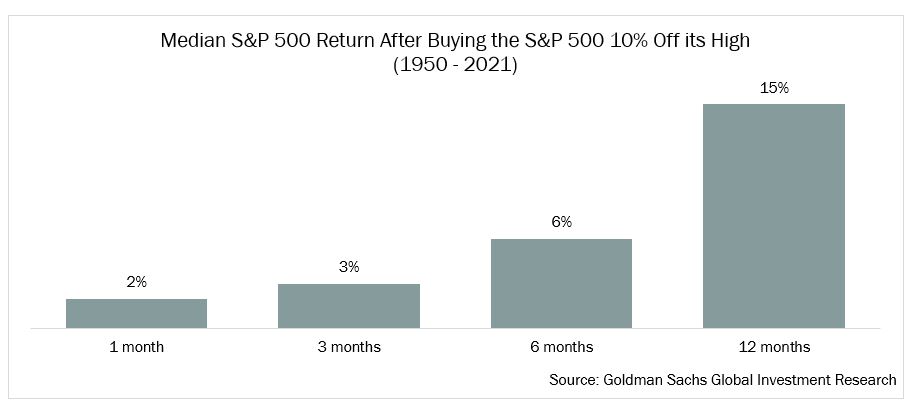
In fact, given the historical upward trajectory of equity prices over time, every selloff in history has been a buying opportunity if your time horizon is long enough. This data, provided by Goldman Sachs, shows that corrections have typically been buying opportunities even for investors with shorter time horizons as well.

Past performance is not a guarantee of future results

Past performance is not a guarantee of future results
Market corrections also present an opportunity to gauge your investment temperament and consider changes to your financial and investment plans. It is human nature to be more tolerant of theoretical losses than real ones. Unfortunately, the best way to gauge your risk tolerance is to live through market volatility. It is also human nature to want to grab the handlebars and try to steer through the turmoil, but the best riders know that a light touch is the best way to navigate through a steep and windy downhill.
Hopefully you were well positioned, both mentally and in your portfolio, to weather January 2022 and whatever February brings To be even more prepared for next time, use the current volatility as a tool to examine your plan, consider your upcoming life milestones, and rebalance if necessary. Our team of portfolio managers and financial planners, are here to help you.
[1] A market correction is a decline of 10%, while a Bear market is considered a decline of 20% or more.
