Tim Hoyle, CFA, Chief Investment Officer
Max Geuder, Research Associate
Dylan Rush, Research Intern
On Friday, August 7, the Labor Department reported that the economy added almost 1.8 million jobs during July, a positive surprise relative to expectations for a gain of 1.5 million. The unemployment rate declined to about 10%, mostly because the participation rate hasn’t changed much at 61.4%. Putting it all in perspective, there are still 14 million fewer jobs in the United States than there were in July 2019 and at least 16.8 million are classified as unemployed.
Overall, the July jobs report was better than expected, but it changes very little for the markets, which are focused on ongoing negotiations for the next round of stimulus. As we wrote last week, the stimulus bill may have to fail before it succeeds. This weekend’s executive orders are evidence that negotiations are still in the failing stage.
A closer look at the employment data provides insight into the great disparity between Main Street economic data and stock market performance. The related creation and concentration of wealth among so few workers also helps to explain the rise of populism, on both the right and left during the past decade. I believe the extent of this imbalance has never been present before in our economy1 and will undoubtedly inform our politics in the future.
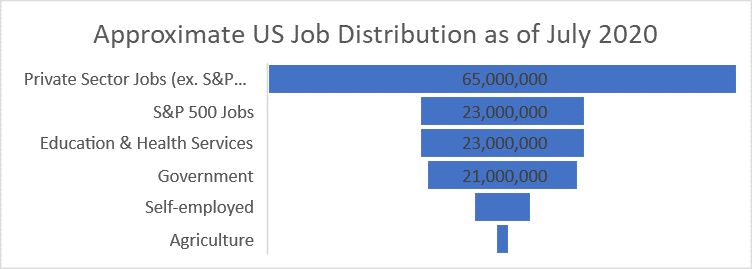
U.S. Employment by companies within the S&P 500 Index only account for about 16% of all jobs in the United States. Private companies employ many more Americans, and therefore, the health of small and private companies has a much greater impact on employment and payrolls.

Source: Bureau of Labor Stastics and The Haverford Trust Company. The S&P 500 Composite Stock Price Index is a capitalization-weighted index of 500 stocks intended to be a representative sample of leading companies in leading industries within the U.S. economy.
Within the S&P 500, jobs are unevenly distributed. Industries representing 18% of the index account for only 4% of total employment.

Source: FactSet, based on company reports. Total employment includes global employees.
1 In the 1950’s AT&T employed over 1 million, while GM peaked at close to 700,000 in the 1970s, and IBM had 365,000 employees during the early 1980s. The largest companies of their era employed a much larger percentage of the workforce.
