Tim Hoyle, CFA, Chief Investment Officer
thoyle@haverfordquality.com
Buy Now, Pay Later
I recently considered buying a 2nd generation Apple pencil. Apple’s website is selling them for $119, or $9.91 a month for 12 months. I then navigated over to Gap.com, where I was able to spread the cost of my purchase of new pair of chinos over 4 interest-free payments, since I spent at least $35. Unfortunately, my Buy Now, Pay Later (“BNPL”) shopping spree ended during a Zillow search of Maine summer homes, which are too rich for my blood no matter how many equal installments they allowed.
The BNPL business model has taken the retail industry by storm. In early August, the payment processing firm Square announced the acquisition of Afterpay for $29 billion. Afterpay allows consumers to shop today, but pay in 4 installments over 6 weeks. Interest free! According to their website, “Afterpay’s business model is completely free for customers who pay on time – helping people spend responsibly without incurring interest, fees or extended debt. Afterpay empowers customers to access the things they want and need, while still allowing them to maintain financial wellness and control, by splitting payments in four, for both online and in-store purchases. If a customer misses a payment, they won’t be able to use Afterpay until the payments are up-to-date. Late payment fees are charged, but are fixed, capped and do not accumulate over time. Customers are never entrapped in revolving debt and never incur interest.” [1]
Buying on installment plans is not new. Many of us have purchased a washer & dryer, bedroom set, or even a car utilizing interest-free monthly payments. What is new is the ability of companies like Afterpay, Klarna, Affirm, Amazon, and Apple, to use financial technology to democratize interest-free purchases for almost everything over $35. BNPL companies have access to vast pools of capital at virtually zero interest rates (who doesn’t in 2021?) to provide these loans to consumers at zero cost. Retailers are willing to pay BNPL companies 4-5% of the value of the transaction, that is double the cost of facilitating a credit or debit card transaction, as they believe it drives more spending and larger basket sizes.
Time will tell if these business models are sustainable and durable. It is likely that many retailers will “white label” BNPL using technology from Apple Pay, Visa, MasterCard, or their existing payment processor.
Who is the largest purveyor of Buy Now, Pay Later? The Federal Government, of course. Ronald Regan embraced the strategy in the 1980’s, and almost every White House since has sought to perfect it. Only President Clinton and Speaker Gingrich were notable outliers. The current Congress is on a spending spree. Deficits are set to rise even as taxes also increase. We expect fireworks to erupt in D.C. following the summer recess, as the fate of the trillion-dollar infrastructure bill, budget reconciliation, tax increases, and debt ceiling will be decided.
Below I have sought to put into perspective what is sure to be a highly contentious and polarizing debate. These comments are meant to be pragmatic, not political.
- It is difficult to find any evidence that higher deficits and debt increase interest rates. Every Congressperson’s personal experience leads them to the same conclusion: deficits don’t matter. They don’t matter now, so the real question is will they matter in the future?
- It is obvious that rising debt loads will lead to higher interest costs, which at some point will reach a tipping point in the federal budget. But we aren’t there yet, and unfortunately, most individuals find it virtually impossible to discount the cost of the future to the present.
- The proposed budget will bring about the largest ever step change increase in government spending relative to the economy. The Federal budget has averaged 20% of GDP since the end of World War II. The proposed budget would increase the Federal government’s role in the economy to 25%.
- While the government has spent money at a pace of about 20% of GDP per year, it has historically collected taxes in the amount of ~17% of GDP. Current proposals will increase tax collection to 20%, back to where we were during the second half of the Clinton administration.
- The budget proposes to double the government’s take of corporate taxes, from 1.2% of GDP this year to 2.4% in 2026. While increasing the individual income tax contribution to close to 10% of GDP.
One logical takeaway from this data would be to say that the proposed level of taxes is not crazy. We have been there before, and it coincided with a time of economic prosperity. And one could argue that some of the spending proposals are desperately needed. American’s roads, ports and bridges are aging and in need of further investment, or we risk losing our competitive advantage in the global economy. But, at the same time, crystalizing government spending at 25% of economic activity is scary for those who believe in free markets and the superior ingenuity of the private sector over the public sector.
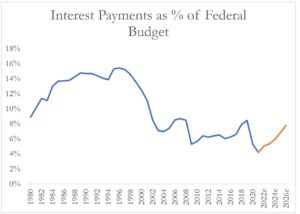
Source: https://www.whitehouse.gov/omb/historical-tables/

Source: https://www.whitehouse.gov/omb/historical-tables/
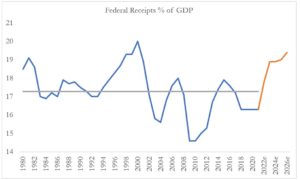
Source: https://www.whitehouse.gov/omb/historical-tables/
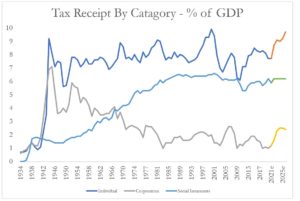
Source: https://www.whitehouse.gov/omb/historical-tables/
Another takeaway from the data may be even harder to swallow. According to our estimates based on the latest IRS data, (from the 2017 tax year)[2] there were approximately 2.4 million returns showing an AGI of greater than $400,000. These taxpayers accounted for approximately 44% of all income tax payments, or $700 billion. If the federal government were to balance the budget in 2026, assuming all the spending and taxes as described above and by taxing only those making over $400,000, these filers would see their tax burden increase to $3.1 trillion dollars. This represents a four-fold increase in taxes paid by this group. This almost impossible scenario leads me to believe that Washington expects to take the BNPL business model one step further: Buy Now, Pay Never
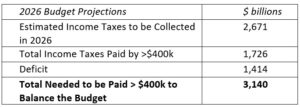
Source: Haverford Estimates [2]
[1] https://corporate.afterpay.com/about/our-story
[2] https://www.irs.gov/statistics/soi-tax-stats-individual-statistical-tables-by-tax-rate-and-income-percentile#earlyRelease
