By: Tim Hoyle, CFA, Chief Investment Officer
On a nostalgic whim, I recently stopped in a Ford dealership to check out the Ford Bronco. I will always vividly remember the weekend adventures in my dad’s Bronco. When I arrived at the dealership, there were no Broncos on the showroom floor. I was told by the helpful sales associate that luckily there was one “used” 2022 on the lot. The MSRP for this vehicle was $55,000 and the dealer was asking $69,000 for it. At that price, my nostalgia quickly dissipated into dismay and I told the salesman that there was no way I was paying 69k for a Bronco of my own. My dad’s 1980’s Bronco ended up in a ditch off Rt 70 in the Jersey pine barrens any way.
According to JD Power, the MSRP of a 1983 Bronco was $10,858[1]. The 2022 MSRP is 5x the 40-year ago price, for an annualized rate of change of 4.2%. This is significantly higher than government inflation statistics reflect. According to the CPI, new car prices have only increased 1.4% annually since the early ‘80s. The difference between 4.2 and 1.4 is massive when compounded over decades. According to the Bureau of Labor Statistics, statistically I should have been able to indulge in my nostalgia for a mere $18,600[2]. At that price I would have said, “Where do I sign!?”
Car prices aren’t the only big-ticket item where reality isn’t in line with the published statistics. A home in my neighborhood that could sell for close to $700,000 today sold in 1988 for $168,000. This 4.3% annualized increase is 1.3 percentage points higher than the CPI reflects. The resulting price difference in 2022: $235,000.
My experiences are certainly anecdotal, but I believe they are indicative of what the average American feels: inflation statistics don’t fully reflect the real world. These examples also show how seemingly small differences compounded over many years result in vast disparities. Federal Reserve Chair Jerome Powell knows that inflation stats aren’t perfect, and he certainly understands compounding, which is why he took the opportunity during Friday’s speech in Jackson Hole, WY to reiterate the Fed’s expectations. “While higher interest rates, slower growth, and softer labor market conditions will bring down inflation, they will also bring some pain to households and businesses. These are the unfortunate costs of reducing inflation. But a failure to restore price stability would mean far greater pain.”
We have cautioned that financial markets may be underestimating the Fed’s resolve in tackling inflation. Markets are hoping that a Fed pivot is on the horizon. Friday’s 3% decline in equity prices is largely a result of Chairman Powell pushing back on those hopes. Despite multiple data releases evidencing that inflation may have already peaked, it is still running way too hot for the Fed to rest easy.
As we have also stated, the current predicament is beyond the Fed’s ability to contain alone. Unfortunately, we are still waiting for an assist on any number of fronts that would make the Fed’s job easier. Russia’s invasion of Ukraine has spread to a war on energy in all of Europe. Ford’s inability to meet Bronco demand reveals continued supply chains issues. China’s zero-covid policy continues to result in rolling shut-downs of major metropolitan areas and manufacturing facilities. This past Monday was horrible for air travelers; several major carriers cancelled up to 40% of their flights due to staffing shortages. And the Federal government continues to pump money into the economy.
The White House’s recent announcement to cancel federal student loan debt will cost at least $300 billion, but probably closer to $500 billion. As of Friday, the Biden administration has admitted to not even knowing the exact cost of their proposal. Starting with the first CARES Act of March 2000, through this most recent announcement on debt cancellation, over $5.7 trillion of incremental spending/stimulus has occurred in the name of Covid. That equates to more than $17,000 for every adult and every child in the United States, or enough for the average family to easily buy a Ford Bronco at today’s inflated prices. More importantly, that is a lot of inflationary pressure for the Fed to fight.

Source: Strategas
Past performance is not a guarantee of future results. Dividends are not guaranteed and will fluctuate. Dividend-yield is one component of performance and should not be the only consideration for investment. Index returns are provided for illustrative purposes only. Indices are unmanaged, do not incur fees or expenses and cannot be invested in directly.
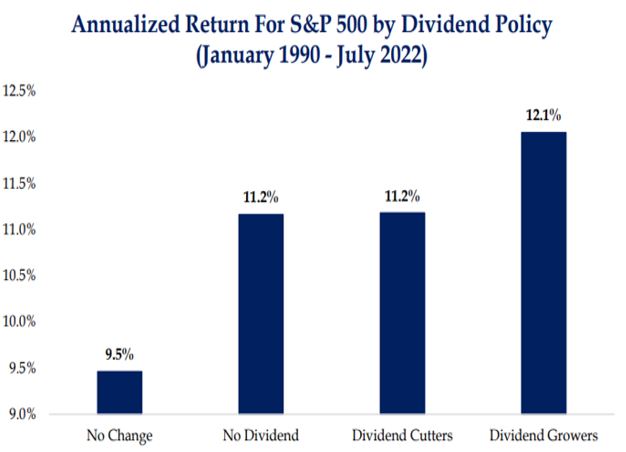
At Haverford, we believe the best way for investors to stay ahead of the long-run risks of inflation is to invest in equities. Dividend paying companies provide both current income and likely future growth. Over the past 40 years, S&P 500 dividends have grown close to 9% per year and the total return of “dividend growers” exceeds those of other stocks on the index. While almost no one purchases a car with an expectation that the price will inflate enough to pay them back when they go to sell, many homeowners do consider their homes to be an investment. Regardless of which way the auto and housing markets go, our strong recommendation remains firmly rooted in the Quality Investing approach to building a portfolio around well capitalized, dividend paying equities. The short-term results for equity investors are often volatile and erratic, but in the long-term we are confident investors will be pleased with their investment in dividend paying companies.
[1] 1983 Ford Bronco 2 Door Wagon 4×4 Prices, Values & Bronco 2 Door Wagon 4×4 Price Specs | NADAguides
[2] Granted, the 1980’s Bronco didn’t have adaptive cruise control, Apple Airplay, air bags, or maybe even seatbelts!
