Tim Hoyle, Co-Chief Investment Officer
thoyle@haverfordquality.com
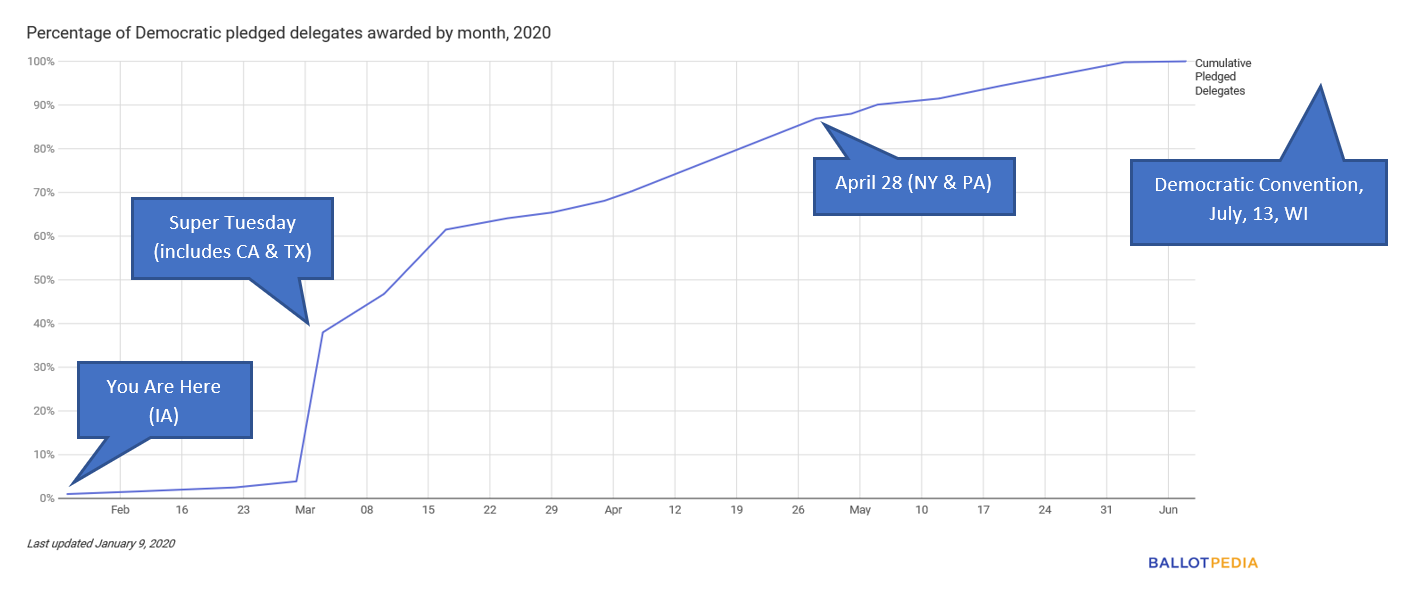
You are Here
I loved maps as a kid. A summer road trip, a map, and a station wagon; the hardest part was not adding up the mileage numbers between points, but trying to figure out how to refold the map correctly! Maps, especially topographical, still fascinate me. The Democratic Primary is like a road trip across the country with one big map, lots of detours, and an unknown destination. On the map of this trip, though, the journey still has a long way to go.

Destination Unknown
Uncertainty can wreak havoc on the stock market, but the unknowns of the democratic process haven’t yet put a dent in the bull market. When it comes to politics, we are often asked “what if” on any number of candidates and outcomes. The best answer starts with the conclusion; we won’t let politics or ideology get in the way of investing. No answer, no matter how politically astute or insightful, should ever overshadow this overarching principal. Forecasting is fraught with error and forecasting market reactions is akin to a third derivative event. What will happen, what consensus believes will happen, and finally how markets will respond.
Based on the results of polls of professional investors done by Vital Knowledge and Strategas Research Partners, close to 80% of professional investors believe President Trump will be re-elected. However, based on PredictIt, the President’s reelection chances as of February 9th were only 54%. There is a risk that at some point along the election journey the market will react to the unknowns of this process. Based on what we know now regarding the fundamentals (a strong economy, low inflation, a dovish Fed, and strong corporate cash flow), we would welcome a sell-off as a potential buying opportunity.
The Course is Clearer Than You Think
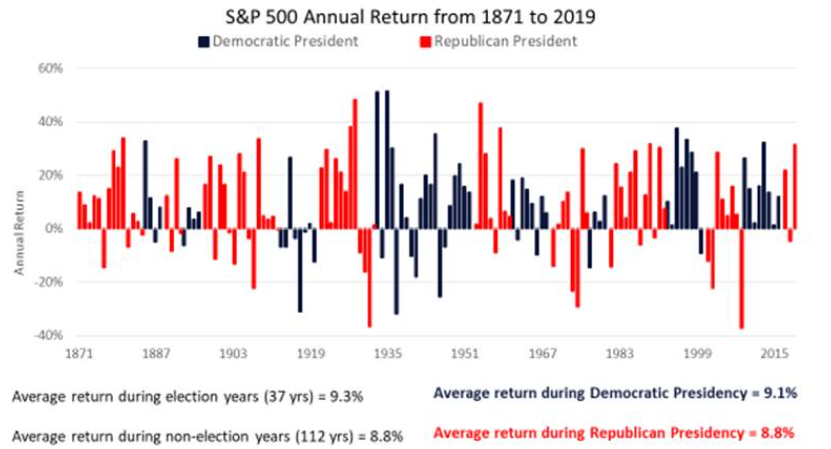
History has shown us that our economy, the markets, and our tri-branch system of government with checks and balances is bigger than any president’s term. Elections have consequences, but not for equity investors, or so shows a chart of historical returns for the S&P 500. The average return for election years is slightly higher than other years, and Democratic terms yield slightly higher returns than Republican. Given the media attention afforded the primaries and the hyper-partisan divide in the electorate, one might be tempted to say this time will be different. Don’t bet on it. Instead, invest based on the fundamentals and avoid the temptation to let partisan politics cloud your investment decisions.

