Tim Hoyle, CFA, Co-Chief Investment Officer
thoyle@haverfordquality.com
Seven Observations on the Worst Monthly Employment Data in History
On Friday, the Bureau of Labor Statistics reported that 20.5 million Americans lost their jobs in April, with a coincident increase in the unemployment rate to 14.7%. Here are seven things to know about the worst monthly reading in our nation’s history.
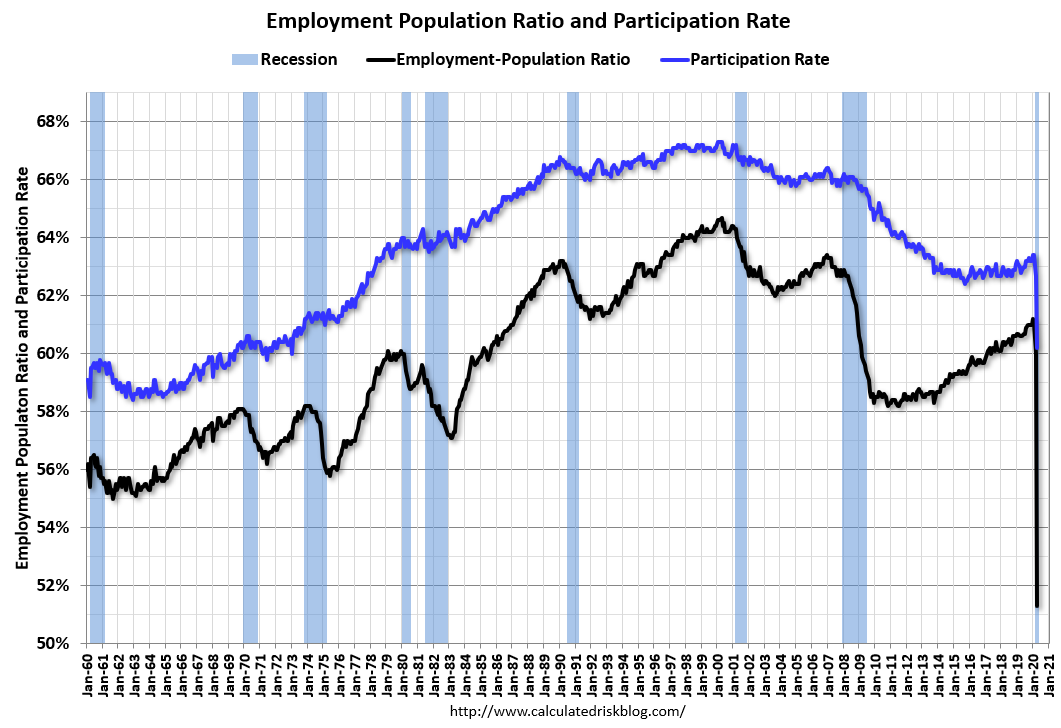
The real unemployment rate is actually much higher. At least one in five Americans is out of work, but the unemployment rate is propped up by a steep drop in labor-force participation. Most unemployed workers can’t effectively job search with lockdown restrictions in place. It also doesn’t include those who are now involuntarily working part time.

Weekly hours worked dropped 0.6%. The number of persons at work part-time for economic reasons nearly doubled over the month to 10.7 million, the equivalent to an additional 750,000 jobs lost.
The recently unemployed are very confident they will return to work. More than three quarters of job losses so far are classified as temporary. Most are optimistic for a swift rebound as the country-wide lockdown is lifted. A swift rebound in jobs would mirror the swift decline.
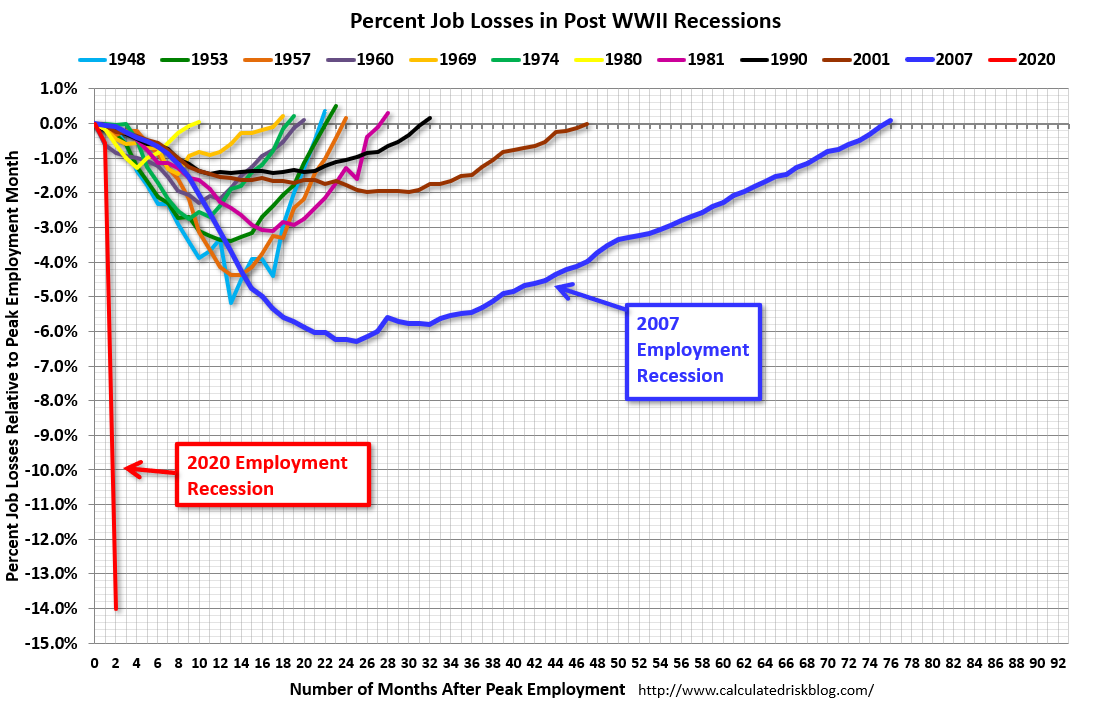
Historically, there is some symmetry to job losses and gains. We can only hope the same holds true for this crisis. The longer the pandemic persists, the harder it will be for businesses to survive and rehire.

Even if 90% of Americans who have been laid off get rehired quickly, there would still be over 3 million additional unemployed.
Small and medium size businesses accounted for 55% of jobs lost, while only accounting for 49% of employment prior to the crisis. Small business will likely be hardest hit by this crisis and could have solvency issues making it more difficult to re-hire these workers.
Investors looked past the job headlines; on Friday the S&P 500 gained 1.7% to 2929.80, up 3.6% on the week. Stocks are trading well on the foundation of six pillars, according to Vital Knowledge.
- Reopening announcements – Countries around the world are all in the midst of reopening their economies;
- Signs of an economic trough – Companies have reported a slight uptick in momentum in the end of April and so far in May;
- Overwhelming amounts of fiscal and monetary stimulus – Government and central banks have responded more aggressively than they did during the financial crisis;
- Faith that earnings will bounce back in 2021 – The consensus range for 2021 S&P 500 EPS is $160-170 implying an 18x multiple;
- Drug and vaccine optimism – There have been positive reports on the effectiveness of Gilead’s Remdesivir, along with progress on several vaccine candidates;
- The unrelenting power of tech –Apple (AAPL), Amazon (AMZN), Microsoft (MSFT), and a few others dominate the index.
We plan on discussing these bullish pillars, as well as examining the bearish narrative, in an upcoming client communication. Stay tuned. In the meantime, stay healthy, stay optimistic, and stay in touch.
