Tim Hoyle, CFA, Chief Investment Officer
thoyle@haverfordquality.com
Riding the Wave
The probability of a blue wave election, which results in a Biden presidency, Democratic control of the Senate, and retaining control of the House of Representatives has been steadily rising in the prediction markets. Several months ago, this outcome was cited as a major market risk, but is now being viewed in a more favorable light; the theory being that full Democrat control will usher in even larger government stimulus. This election could also result in a wave of tax changes. If the Democrats win the Senate, it is viewed as almost a certainty that tax rates will rise on high-wage earners, corporate income, and capital gains.
Today, we review the capital gains tax rate, and what its increase might mean for asset prices. Vice President Biden’s proposal is for the long-term capital gains tax rate to rise to 39.6% from the current rate of 23.8% for high-income tax payers, an increase of 16 percentage points. This would be the largest tax increase on capital since the late 1960s when rates rose a total of 24 percentage points over the course of 8 years (from 25 percent in 1968 to 49 percent in 1976).[1] In more recent times, capital gains taxes increased 8 percentage points in 1987 and 10 percentage points in 2013.
There are likely near-term and long-term consequences to higher capital gains taxes. In the long-term, conventional economic wisdom posits that higher taxes are a negative for growth. Lower after-tax returns on capital theoretically increase business’ cost of capital, reduce capital mobility, and stymie risk taking. It is difficult to find historical empirical evidence that shows meaningful economic impact from capital gains tax changes. JP Morgan research goes a step further, positing that in today’s low yield environment “any longer term impact from a capital gains tax rate hike on risk taking and investors’ attitude towards equities as an asset class would be even more muted relative to the past.”[2]
The effect of higher capital gains taxes on the nearer-term outlook for equity price is more negative. JP Morgan estimates that investors locking in gains at a lower rate could cause $400 billion in asset sales and pressure equity prices by about 5%. The amount of stock held in taxable accounts is an astonishing low percent of total stock held. According to the Federal Reserve, as of 2015, only about 25% of U.S. corporate stock was held in taxable accounts.
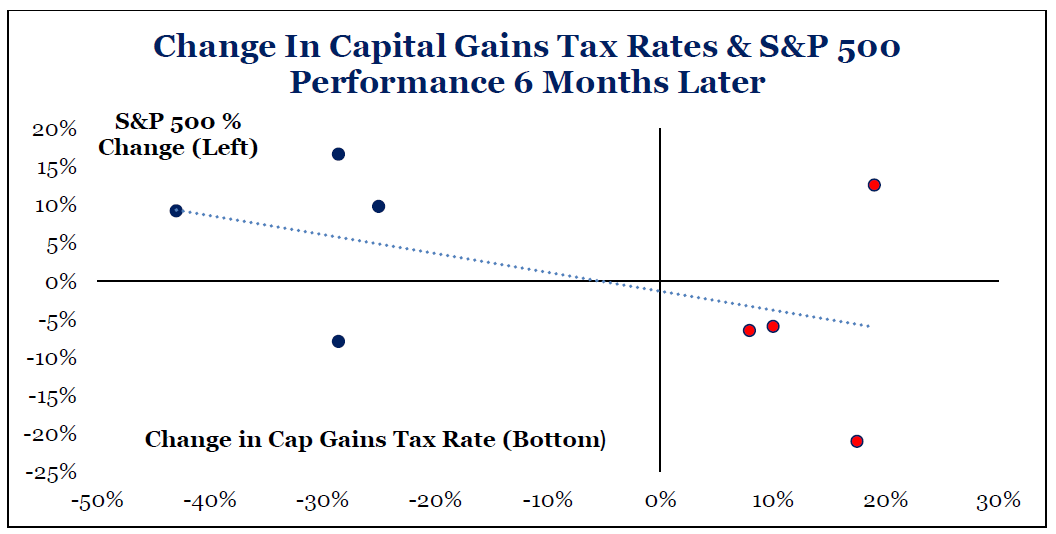
Strategas Research has recently published data showing the relationship between tax rate changes and subsequent six-month performance. Their research indicates that a rise in capital gains taxes could lead to a 5-15% decline in stock prices.
Even if the data was 100% conclusive that higher taxes would bring down asset prices by 10%, it is still entirely uncertain that investors should hit the sell button today. We do not know when stocks will discount the future tax hikes. A tax hike starting on January 1, 2022 (the most likely scenario in a blue wave election) might be priced in by December of this year, well before tax-related selling pressures should occur, which would then set the market up for higher future gains. The benefit of realizing taxes today to avoid future taxes is very dependent on your investment time horizon.

To help explain, let’s look at the hypothetical path of two investors. In scenario 1, both own $100 worth of stock with a $50 basis. Andrew is worried about the blue wave and looks to sell his assets today to lock in lower taxes, while Mark has chosen to ride out the wave. Taxes aside, both investors are inclined to own their shares for another 10 years, at which time they plan to sell it to purchase a vacation home. Andrew becomes afraid that capital gains taxes will rise to 40% (I will use round numbers to keep it simple) and sells his stock this December. He pays the $12 in taxes and reinvests the $88 net of tax proceeds back into his favorite investment. Mark chooses to do nothing. In 10 years, the stock has done very well, compounding at a 10% annual rate, at which time both investors sell their shares. In this scenario Mark makes out better, because time and the value of compounding are on his side. In this simple example, Mark makes out better with any time horizon over 8 years, while Andrew would make out better if the stock were sold anytime before the 8-year threshold.


Scenario 1 assumes a straight-line returns and a sale and immediate repurchase of stock. But what if Andrew is very worried in December when the political climate is charged with heated debate? His stock is down 10% and he decides to sell to avoid more pain plus the potential of higher taxes in the future. In scenario 2, instead of buying right back in, he waits until the coast is clear, and the stock is once again trading for $100. He sells for $90, pays the taxes and buys back in at $100. During this time, Mark rides out both a turbulent market and the rancorous political debate with his original shares. The market then continues to compound as in the previous example. In this scenario, Andrew has shot himself in the foot. Regardless of time horizon, selling at a depressed price to lock in lower taxes is short-sighted.


The key takeaways of this analysis:
- If you have the need for cash within the next three to five years, consider realizing some gains today to minimize your tax liability.
- The longer your investment horizon the less valuable this strategy becomes.
- And finally, no tax savings will offset the damage that can be done if you sell in fear and buy back at higher prices.
Key caveats to this analysis:
- This is a hypothetical thought experiment based on election proposals, not signed policy, or even a proposed bill.
- The rates being used here will only apply to “high-income” taxpayers. Based on our current understanding, the definition of high-income could be anywhere from $400,000 to $1 million of annual income.
- And finally, everyone’s situation is unique. At Haverford we know that there is no one-size-fits-all solution. Please give us a call to discuss and develop a solution for your distinct situation.
[1] The capital gains rate in 1978 was 40%, but rose to 49% based on interaction with the maximum tax and certain phaseouts applied to high income taxpayers.
[2] Global Macro Strategy, JP Morgan, October 9, 2020
The hypothetical scenarios provided are for illustrative purposes only.
