John Donaldson, Vice President & Director of Fixed Income
jdonaldson@haverfordquality.com
Crowding Out in the Bond Market, Extinct or Just Dormant?
As of September 5, 2024, the total debt of the U.S. Government was $35.3 trillion. That compares to $22.7 trillion at the end of the 2019 fiscal year and $17.8 trillion at the end of the 2014 fiscal year. The U.S. Treasury’s Monthly Budget Statement shows a $1.5 trillion deficit through July. If this rate of spending persists, the total deficit for the 2024 fiscal year will approach $2 trillion, again. Given the size of the current U.S. debt and its explosive growth in recent years, one would expect borrowers to be experiencing the “Crowding Out” effect.
The concept of “Crowding Out” in the bond market is often included in Economic and Finance textbooks. This concept suggests excessive borrowing by the government requires so much capital that there are often insufficient funds remaining to meet the needs of other borrowers, which results in higher interest rates for all.
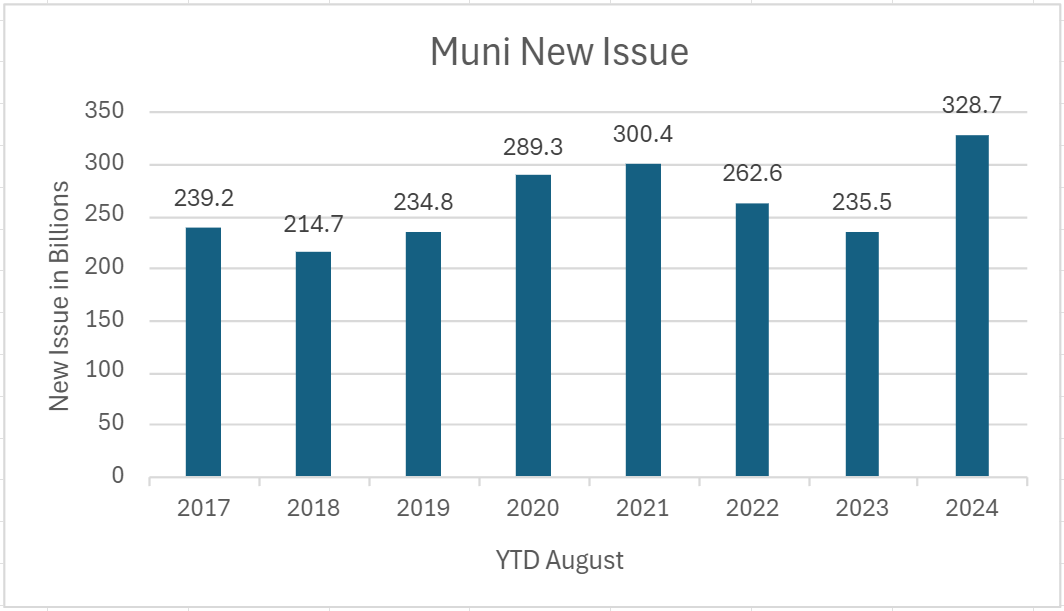
However, even with the current U.S. debt and the rate at which it is increasing, we are not seeing any evidence of an increase in rates for borrowers. To provide some context around the current bond market, investment grade corporate bonds have seen a total of $1.2 trillion in debt issued this year through the end of August. Tuesday, September 3rd saw 29 borrowers sell $43.3 billion in new bonds, which was the most crowded single session on record and the third highest by dollar volume. Similarly, state and local governments issued $328.7 billion in new borrowings, setting a record for the first eight months of a year as shown in the chart (below). Interest rates have decreased from their recent peaks with both the 5-year and 10-year U.S. Treasury notes having touched 5% yields during October 2023. They are trading at 3.48% and 3.70%, respectively as of today, September 10th. The yield on the investment grade corporate index has returned to its lowest level since August 2022 and the yield on the tax-exempt municipal bond index is also 100 basis points below its level from October 2023.

Muni New Issue bar chart YTD August 2024
Source: Bloomberg L.P.
While we do not see any evidence of crowding out today, we should continue to question the theory. Is it like Atlantis or Shangri-La that likely never existed at all? Is it like the dinosaurs that were once living creatures but now extinct? Or perhaps, is it like a dormant volcano on the horizon that has not been active for a millennium, but you know could eventually erupt? One caution would be that there is a wide chasm between geologic time and the attention span of the markets.
Media Inquiries
Veronica Mckee, CMP
Direct Phone: 610.995.8758
Email: vmckee@haverfordquality.com
Katie Karsh
Direct Phone: 610.755.8682
Email: katie@gobraithwaite.com
Disclosure
These comments are provided as a general market overview and should not be relied upon as a forecast, research or investment advice, and is not a recommendation, offer, or solicitation to buy or sell any securities or to adopt any investment strategy. Opinions expressed are as of the date noted and may change at any time. The information and opinions are derived from proprietary and non-proprietary sources deemed by Haverford to be reliable, but are not necessarily all-inclusive and are not guaranteed as to accuracy. Index returns are presented for informational purposes only. Indices are unmanaged, do not incur fees or expenses, and cannot be invested in directly.
Investments in Securities are Not FDIC Insured · Not Bank Guaranteed · May Lose Value


