Last Week:
- U.S. equities finished positive for the week: Last week, U.S. stocks rallied to all-time highs, erasing last year’s declines. The main drivers over the last several months have been a more accommodative Fed, rising corporate earnings, and optimism around easing trade tensions. During the week, the Dow Jones Industrial Average (Dow) gained 32 points, or rose 0.12%, to 26,543. The Standard & Poor’s (S&P500) index increased 32 points, or rose 1.10% to 2,940. The Nasdaq closed 1.64% higher at 8,146 while the 10-year Treasury ended the week at 2.50%.
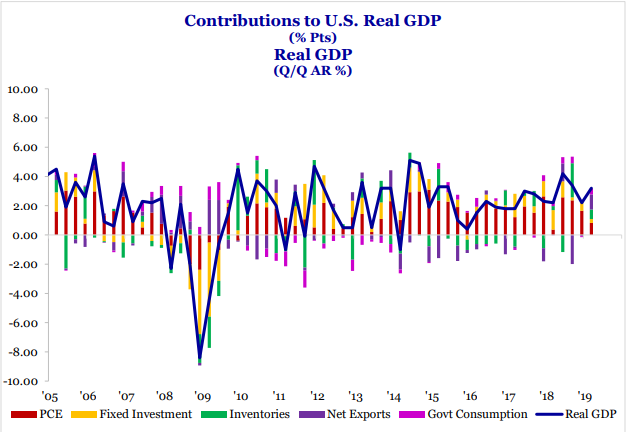
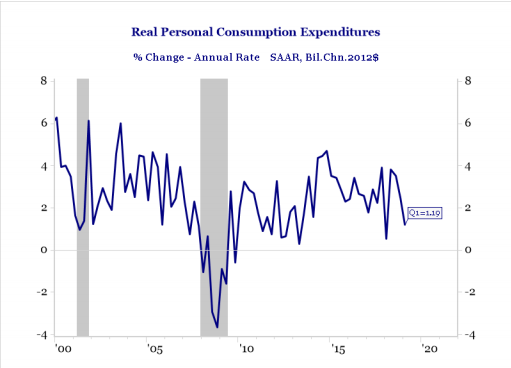
- Economic Data Recap: According to the Commerce Department, U.S. real Gross Domestic Product (GDP) grew +3.2% in the first quarter, significantly above economists’ expectations of +2.3% and above any single guess in the Bloomberg survey. This marks the strongest start to the year for GDP numbers we have seen since 2015. Although a buildup in inventories contributed to the upside beat, stripping that factor out leaves +2.5% growth, which is still very robust. The American consumer remains strong, with spending growth of +1.2% above expectations of 1%, although a slowdown from the fourth quarter’s +2.5% pace. Although the impact of the longest federal government shutdown and the winter weather make it difficult to discern the underlying trends during the quarter, the report helped abate investor fears around a looming economic downturn.
- One striking aspect of the GDP data was the subdued inflation number, which played a role in driving the real GDP number higher. Inflation as measured by the personal consumption expenditures (PCE) price index, the Fed’s preferred measure, only increased +0.6% during the quarter, marking the lowest reading since early 2016, compared with +1.5% during the prior quarter. Core PCE, which strips out food and energy, increased +1.3% compared with +1.8%, +1.6% and +2.1% from the last three quarters. For financial markets, the positives from the report outweighed the slowdown in residential investment and uptick in inventories during the quarter.

Source: The Bureau of Economic Analysis, Strategas Research Partners

Source: The Bureau of Economic Analysis, Strategas Research Partners
Look Ahead:
- The corporate calendar will be very busy this week as first quarter earnings season continues. Notable reporters include Merck, Mastercard, Eaton, Apple Inc., CVS Health, Automatic Data Processing, Johnson Controls, DowDuPont, S&P Global, Dow, Inc., and American Tower Corp, among others. There will also be a number of broker conferences and investor meetings during the week.
- On the economic calendar, we will see Personal Income data, Chicago PMIs, Consumer Confidence, MBA Applications, Construction Spending, Auto Sales, Factory Orders, Productivity data, and the April Jobs Report to end the week. The Federal Open Market Committee (FOMC) will issue an interest rate decision on Wednesday.
