Last Week:
- U.S. equities finished mixed for the week: On the week, the Dow Jones Industrial Average (Dow) lost 5 points, or fell 0.02%, to 26,026. The Standard & Poor’s (S&P500) index increased 11 points, or rose 0.39% to 2,804. The Nasdaq closed 0.90% higher at 7,595 while the 10-year Treasury ended the week at 2.75%.
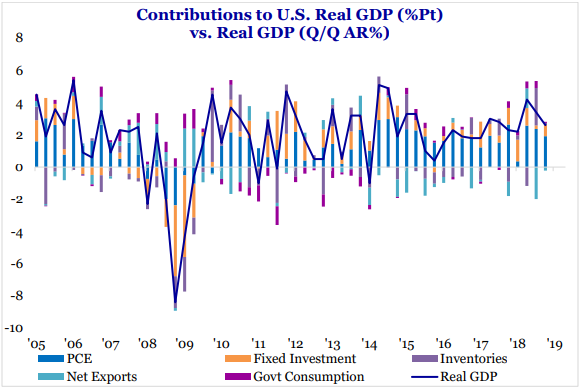
- Economic Data Recap: According to the Commerce Department, U.S. real Gross Domestic Product (GDP) grew +2.6% in the fourth quarter, bringing the full year GDP growth rate to +2.9%. Although the growth rate during the fourth quarter remained strong and came in above economist expectations, it was at a slower pace compared to the +3.4% during the third quarter and +4.2% during the second quarter. One of the positives from the report was the strong consumer spending growth of +2.8%, above the +2.4% average growth in this expansion so far. Accounting for two-thirds of economic activity, the strong consumer spending number was particularly encouraging considering we saw a retail sales decline in December. Another positive from the report was the 6.2% growth in non-residential fixed investment, up from 2.5% growth during the third quarter as companies spent more on research and development, software, equipment and structures. For financial markets, the positives from the report outweighed the slowdown in residential investment and uptick in inventories during the quarter.
- Outside the U.S., last week’s Purchasing Managers Index (PMI) numbers from Europe and China were not particularly encouraging. The Eurozone manufacturing PMI fell to 49.3 in February, entering contraction (below 50) territory for the first time in 5 years driven by a slowdown in Italy and Germany. In China, we also saw the NBS manufacturing PMI fall to 49.2, marking the third straight month of contraction and the steepest in three years. With that said, global equities still rallied last week as investors got more optimistic about a resolution of the U.S./China trade dispute.

Source: Strategas Research Partners, U.S. Bureau of Economic Analysis
Look Ahead:
- Fourth quarter earnings season will continue to wrap up this week, with expected earnings releases from Target, Ross Stores, Urban Outfitters, American Eagle, Dollar Tree, Costco, Kroger, and H&R Block, among others. There will also be a number of broker conferences during the week.
- On the economic calendar, we will see New Home Sales, Institute of Supply Management Non-Manufacturing Index, ADP Employment Report, Consumer Credit data, Housing Starts, and the Jobs Report on Friday.
