John Donaldson, Vice President, Director of Fixed Income
jdonaldson@haverfordquality.com
What is the Bond Market Telling Us about the Economy?
The economic data released on Friday, August 29th was in line with expectations. Headline Personal Consumption Expenditure Price Index (PCE), the Fed’s preferred measure of inflation, increased 2.6% year-over-year while Core PCE, which excludes food and energy prices, increased 2.9%. Personal income was up 0.4% compared to the previous month while personal spending increased 0.5%. Based upon their August meeting comments as well as these datapoints, the Federal Open Market Committee (FOMC) is very likely to decrease rates by 25 basis points at their September meeting. The most important piece of data between now and then will be the August jobs numbers which are released later this week on September 5th.
While the Fed can set short-term rates, the free market is the primary driver of longer-term rates and credit spreads.
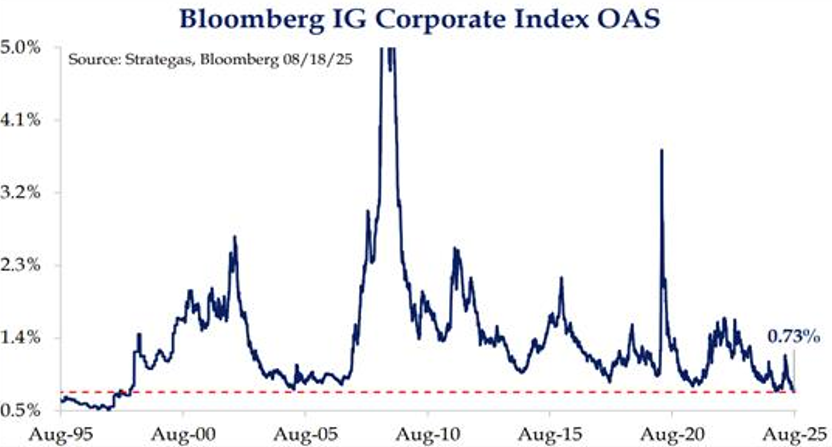
Overall, the bond market has been sending mixed signals regarding the economy, interest rates and relative valuation. First, corporate credit spreads are relatively tight. Credit spreads are the difference in yield between corporate bonds and yields available on comparable U.S. Treasury issues. Corporate bond yields are currently signaling that investors have no concerns regarding the economy’s continued upward trajectory in the year ahead. There is a historical correlation between rising equity markets and tight spreads. That makes sense as investors having a positive outlook for corporate America that can manifest itself in rising equity prices and a lower risk premium (credit spread). It is important to note that Financial sector spreads are only 1 basis point (0.01%) wider than that of the broad corporate bond market. When there is impending risk, spreads on Financial bonds are often the first to widen and tend to widen more than Industrials and Utilities.
Unlike the broader Financial sector, the U.S. Agency Mortgage-backed securities (MBS) market is trading wider than average. Elevated mortgage rates present challenges for homebuyers yet offer compelling returns for investors. Investors in newly issued MBS can purchase a 5.5% coupon issue at, r (the face value of a bond which the issuer promises to repay at maturity.) The 5.5% yields on MBS compare very favorably to the 4.2% yield on 10-year U.S. Treasuries in addition to yields on most intermediate investment grade corporate bonds.
The yield curve presents investors with a dilemma of whether to invest in short-term or longer-term bonds. It does appear the Federal Reserve is likely to begin cutting short-term rates in the near future. However, due to a glut of supply from the U.S. Treasury, a 2-month T-Bill at 4.2% is trading in-line with a 10-year Treasury Note. Meanwhile, the 2-year Note has a 3.6% yield. and a weaker economy or solely a result of supply/demand technical factors? We prefer shorter issues which have an over supply and slightly longer issues whose yields have not responded as much to potential Fed moves. The 2-year yield at 3.6% is less attractive as it has already anticipated the Fed.

Bloomberg IG Corporate Index OAS
Source: Strategas, Bloomberg 08/18/25
The Bloomberg IG Corporate Index Option-Adjusted Spread (OAS) represents the yield spread of investment grade corporate bonds to U.S. Treasury bonds of comparable duration, or how much investors are compensated relative to what is considered the risk-free asset. The option adjusted terminology refers to the adjustment made for the portion of the corporate bonds in the index with callability. If a bond is callable, that could shorten the maturity and duration of the bond, which is essentially an embedded option, and the spread is adjusted accordingly.
In closing out this week’s commentary we would like to share an additional set of economic data that can help shed some light on how people are viewing the outlook for the U.S. economy is the Conference Board’s monthly survey on Consumer Confidence. The July survey showed an unremarkable overall index of 97.4, nearly neutral to the baseline of 100. The underlying components provide illumination on consumer psychology, however, with the Present Situation survey at an optimistic 131.2 while the Expectations survey was pessimistic at a much lower 74.8. That large gap illustrates a theme which has been consistent since May 2021: a belief that things are okay today but the future may not be as fruitful. We have now seen more than four years of pessimism contradicted by strength. We continue to be buoyed by the performance of the economy.
Media Inquiries
Veronica Mckee, CMP
Direct Phone: 610.995.8758
Email: vmckee@haverfordquality.com
Katie Karsh
Direct Phone: 610.755.8682
Email: katie@gobraithwaite.com
Disclosure
These comments are provided as a general market overview and should not be relied upon as a forecast, research or investment advice, and is not a recommendation, offer, or solicitation to buy or sell any securities or to adopt any investment strategy. Opinions expressed are as of the date noted and may change at any time. The information and opinions are derived from proprietary and non-proprietary sources deemed by Haverford to be reliable, but are not necessarily all-inclusive and are not guaranteed as to accuracy. Index returns are presented for informational purposes only. Indices are unmanaged, do not incur fees or expenses, and cannot be invested in directly.
Investments in Securities are Not FDIC Insured · Not Bank Guaranteed · May Lose Value

